更新时间:2022-02-22 来源:黑马程序员 浏览量:
使用pyplot的hist()函数可以快速绘制直方图,hist()函数的语法格式如下所示:
hist(x, bins=None, range=None, density=None, weights=None,
     cumulative=False, bottom=None, histtype='bar', align='mid',
     orientation='vertical', rwidth=None, log=False, label=None,
     stacked=False, normed=None, *,data=None, **kwargs)
该函数常用参数的含义如下。
·x:表示x轴的数据,可以为单个数组或多个数组的序列。
·bins:表示矩形条的个数,默认为10。
·range:表示数据的范围。若没有提供range参数的值,则数据范围为(x.min(),x.max())。
·cumulative:表示是否计算累计频数或频率。
·histtype:表示直方图的类型,支持'bar'、'barstacked'、'step'、'stepfilled'四种取值,其中'bar'为默认值,代表传统的直方图;'barstacked'代表堆积直方图;'step'代表未填充的线条直方图;'stepfilled'代表填充的线条直方图。
·align:表示矩形条边界的对齐方式,可设置为'left'、'mid'或'right',默认为'mind'。
·orientation:表示矩形条宽度的百分比,默认为0。若histtype的值为'step'或'stepfilled',则直接忽略rwidth参数的值。
·stacked:表示是否将多个矩形条以堆积形式摆放。
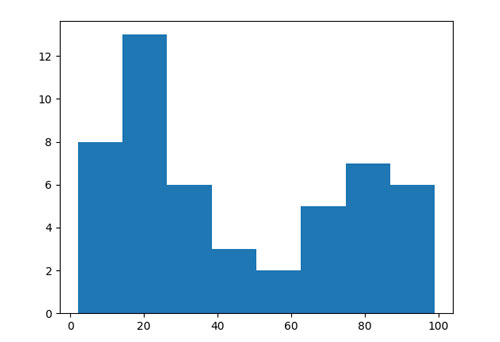
例如,绘制一个具有8个矩形条填充的线条直方图,代码如下。
import matplotlib.pyplot as plt
import numpy as np
# 准备50个随机测试数据
scores = np.random.randint(0,100,50)
# 绘制直方图
plt.hist(scores, bins=8, histtype='stepfilled')
plt.show()
运行程序,效果如图2-14所示。

图2-14 填充的线条直方图示例