全国中心


 AI智能应用开发
 AI大模型开发
 AI鸿蒙开发
 AI嵌入式+
 AI大数据开发
 AI运维
AI运维 AI测试
AI测试 跨境电商运营
 AI设计
AI设计 AI视频创作运营
免费领取黑马程序员AI通道专属星级课程资料

更新时间:2022-11-03 来源:黑马程序员 浏览量:

在Python中,我们通过运用numpy可视化库,可以构建特效代码来绘制流星雨的效果图,具体实现代码如下:
import numpy as np
import matplotlib.pyplot as plt
from matplotlib.collections import LineCollection

x0, y0 = 1, 1  # 此为流星位置
ts = np.arange(0, 1, 0.01)  # 参数
xs, ys = x0 + ts, y0 + ts  # 绘图线条

points = np.array([xs, ys]).T.reshape(-1, 1, 2)
segments = np.concatenate([points[:-1], points[1:]], axis=1)

ax = plt.subplot()
lc = LineCollection(segments, cmap='viridis')

lc.set_array(ts)
lc.set_linewidth(ts[::-1])
line = ax.add_collection(lc)

ax.set_xlim(0, 3)
ax.set_ylim(0, 3)
plt.show()
运行程序,效果如图1-1所示。
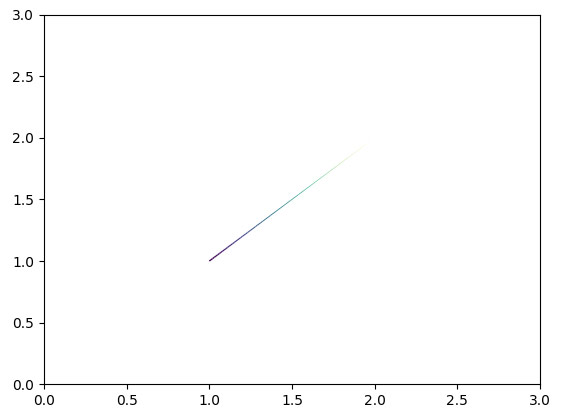
图1-1 用Python绘制的流星雨效果图
如果想绘制很多流星雨的效果图,实现代码如下。
from numpy.random import rand, randint
from matplotlib.collections import LineCollection

import numpy as np
import matplotlib.pyplot as plt

N, L = 20, 100  # 流星个数和线段数
ts = np.array([
    np.linspace(0, rand(), L) for _ in range(N)]).T
x0, y0 = rand(2 * N).reshape(2, 1, N)
x0 *= 5
xs, ys = x0 + ts, y0 + ts  # 绘图线条1

points = np.array([xs, ys]).T.reshape(N, L, -1, 2)

ax = plt.subplot()
for i in range(N):
    segs = np.concatenate([points[i][:-1], points[i][1:]], axis=1)
    lc = LineCollection(segs, cmap='viridis')
    lc.set_array(ts[:, i])
    lc.set_linewidth(ts[::-1, i])
    ax.add_collection(lc)

ax.set_xlim(0, 6)
ax.set_ylim(-2, 3)
ax.set_axis_off()  # 取消坐标轴
plt.show()
运行程序,效果如图1-2所示。

图1-2 用Python绘制多条流星雨的效果图


.jpg)